简介
2016年11月的时候决定开始入坑机器学习 首先照着Kaggle上第一个题目《泰坦尼克号生还者分析》的官方示例敲了一遍。
2017年2月更新:用pandas重新整理了数据,计算了详细的正确率,试用了scikit-learn中的LinearRegression
题目介绍在这:Titanic: Machine Learning from Disaster
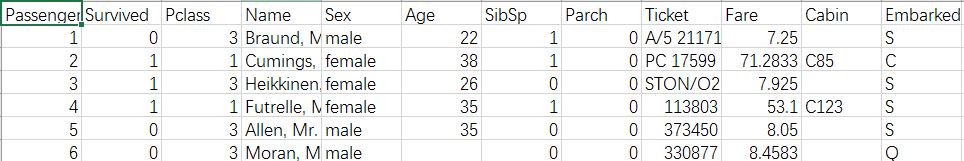
下面是数据集表格样式,每个人有12个属性
不是算法的算法
官方示例就是按几个属性分类,比如年龄,性别,票价(.....)
然后对每个属性内所有人的生还数据(0或者1)加一起求平均。
英文注释都是官方文档的说明 我就当入门教程学了,也全打了上去 代码如下:
1
2
3
4
5
6
7
8
9
10
11
12
13
14
15
16
17
18
19
20
21
22
23
24
25
26
27
28
29
30
31
32
33
34
35
36
37
38
39
40
41
42
43
44
45
46
47
48
49
50
51
52
53
54
55
56
57
58
59
60
61
62
63
64
65
66
67
68
69
70
71
72
73
74
75
76
77
78
79
80
81
82
83
84
85
86
87
88
89
90
91
92
93
94
95
96
97
98
99
100
101
102
103
104
105
106
107
108
109
110
111
112
113
114
115
116
117
118
119
120
121
122
123
124
125
126
127
128
129
130
131
132
133
134
135
136
137
138
139
140
141
142
143
144
145
146
147
148
149
150
151
152
153
154
155
156
157
158
159
160
161
162
163
164
165
166
167
168
169
170
171
172
173
174
175
176
177
178
179
180
181
182
183
184
185
186
187
188
189
190
191
192
193
# -*- coding: utf-8 -*-
"""
Created on Sun Oct 30 15:28:22 2016
@author: thinkwee
"""
import csv as csv
import numpy as np
from glue import qglue
test_file=(open(r'文件目录略', 'r'))
test_file_object = csv.reader(open(r'文件目录略', 'r'))
testheader = next(test_file_object)
predictions_file = open(r"文件目录略", "w")
predictions_file_object = csv.writer(predictions_file)
p = csv.writer(predictions_file)
p.writerow(["PassengerId", "Survived"])
csv_file_object = csv.reader(open(r'文件目录略', 'r'))
trainheader = next(csv_file_object) # The next() command just skips the
# first line which is a header
data=[] # Create a variable called 'data'.
for row in csv_file_object: # Run through each row in the csv file,
data.append(row) # adding each row to the data variable
print(type(data))
data = np.array(data) # Then convert from a list to an array
# Be aware that each item is currently
# a string in this format
number_passengers = np.size(data[0::,1].astype(np.float))
number_survived = np.sum(data[0::,1].astype(np.float))
proportion_survivors = number_survived / number_passengers
women_only_stats = data[0::,4] == "female" # This finds where all
# the elements in the gender
# column that equals “female”
men_only_stats = data[0::,4] != "female" # This finds where all the
# elements do not equal
# female (i.e. male)
# Using the index from above we select the females and males separately
women_onboard = data[women_only_stats,1].astype(np.float)
men_onboard = data[men_only_stats,1].astype(np.float)
# Then we finds the proportions of them that survived
proportion_women_survived = \
np.sum(women_onboard) / np.size(women_onboard)
proportion_men_survived = \
np.sum(men_onboard) / np.size(men_onboard)
# and then print it out
print ('Proportion of women who survived is %s' % proportion_women_survived)
print ('Proportion of men who survived is %s' % proportion_men_survived)
# The script will systematically will loop through each combination
# and use the 'where' function in python to search the passengers that fit that combination of variables.
# Just like before, you can ask what indices in your data equals female, 1st class, and paid more than $30.
# The problem is that looping through requires bins of equal sizes, i.e. $0-9, $10-19, $20-29, $30-39.
# For the sake of binning let's say everything equal to and above 40 "equals" 39 so it falls in this bin.
# So then you can set the bins
# So we add a ceiling
fare_ceiling = 40
# then modify the data in the Fare column to = 39, if it is greater or equal to the ceiling
data[ data[0::,9].astype(np.float) >= fare_ceiling, 9 ] = fare_ceiling - 1.0
fare_bracket_size = 10
number_of_price_brackets = fare_ceiling // fare_bracket_size
# Take the length of an array of unique values in column index 2
number_of_classes = len(np.unique(data[0::,2]))
number_of_age_brackets=8
# Initialize the survival table with all zeros
survival_table = np.zeros((2, number_of_classes,
number_of_price_brackets,
number_of_age_brackets))
#Now that these are set up,
#you can loop through each variable
#and find all those passengers that agree with the statements
for i in range(number_of_classes): #loop through each class
for j in range(number_of_price_brackets): #loop through each price bin
for k in range(number_of_age_brackets): #loop through each age bin
women_only_stats_plus = data[ #Which element
(data[0::,4] == "female") #is a female
&(data[0::,2].astype(np.float) #and was ith class
== i+1)
&(data[0:,9].astype(np.float) #was greater
>= j*fare_bracket_size) #than this bin
&(data[0:,9].astype(np.float) #and less than
< (j+1)*fare_bracket_size)
&(data[0:,5].astype(np.float)>=k*10)
&(data[0:,5].astype(np.float)<(k+1)*10)#the next bin
, 1] #in the 2nd col
men_only_stats_plus = data[ #Which element
(data[0::,4] != "female") #is a male
&(data[0::,2].astype(np.float) #and was ith class
== i+1)
&(data[0:,9].astype(np.float) #was greater
>= j*fare_bracket_size) #than this bin
&(data[0:,9].astype(np.float) #and less than
< (j+1)*fare_bracket_size)#the next bin
&(data[0:,5].astype(np.float)>=k*10)
&(data[0:,5].astype(np.float)<(k+1)*10)
, 1]
survival_table[0,i,j,k] = np.mean(women_only_stats_plus.astype(np.float))
survival_table[1,i,j,k] = np.mean(men_only_stats_plus.astype(np.float))
#if nan then the type will change to string from float so this sentence can set nan to 0.
survival_table[ survival_table != survival_table ] = 0.
#Notice that data[ where function, 1] means
#it is finding the Survived column for the conditional criteria which is being called.
#As the loop starts with i=0 and j=0,
#the first loop will return the Survived values for all the 1st-class females (i + 1)
#who paid less than 10 ((j+1)*fare_bracket_size)
#and similarly all the 1st-class males who paid less than 10.
#Before resetting to the top of the loop,
#we can calculate the proportion of survivors for this particular
#combination of criteria and record it to our survival table
#官方示例中将概率大于0.5的视为生还,这里我们略过
#直接打印详细概率
#survival_table[ survival_table < 0.5 ] = 0
#survival_table[ survival_table >= 0.5 ] = 1
#Then we can make the prediction
for row in test_file_object: # We are going to loop
# through each passenger
# in the test set
for j in range(number_of_price_brackets): # For each passenger we
# loop thro each price bin
try: # Some passengers have no
# Fare data so try to make
row[8] = float(row[8]) # a float
except: # If fails: no data, so
bin_fare = 3 - float(row[1]) # bin the fare according Pclass
break # Break from the loop
if row[8] > fare_ceiling: # If there is data see if
# it is greater than fare
# ceiling we set earlier
bin_fare = number_of_price_brackets-1 # If so set to highest bin
break # And then break loop
if row[8] >= j * fare_bracket_size\
and row[8] < \
(j+1) * fare_bracket_size: # If passed these tests
# then loop through each bin
bin_fare = j # then assign index
break
for j in range(number_of_age_brackets):
try:
row[4] = float(row[4])
except:
bin_age = -1
break
if row[4] >= j * 10\
and row[4] < \
(j+1) * 10: # If passed these tests
# then loop through each bin
bin_age = j # then assign index
break
if row[3] == 'female': #If the passenger is female
p.writerow([row[0], "%f %%" % \
(survival_table[0, int(row[1])-1, bin_fare,bin_age]*100)])
else: #else if male
p.writerow([row[0], "%f %%" % \
(survival_table[1, int(row[1])-1, bin_fare,bin_age]*100)])
# Close out the files.
test_file.close()
predictions_file.close()
多元线性回归
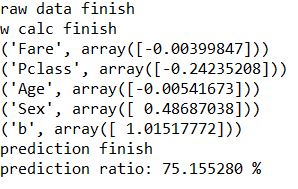
之后买了西瓜书,我把这个例题改成了线性回归模型: 假设每一个人生还可能与这个人的性别,价位,舱位,年龄四个属性成线性关系, 我们就利用最小二乘法找到一组线性系数,是所有样本到这个线性函数直线上的距离最小 用均方误差作为性能度量,均方误差是线性系数的函数 对线性系数w求导,可以得到w最优解的闭式
关键公式是 ** \[ w^*=(X^TX)^{-1}X^Ty \] **
- X:数据集矩阵,每一行对应一个人的数据,每一行最后添加一个1, 假如训练集有m个人,n个属性,则矩阵大小为m*(n+1)
- w:线性系数
- y:生还结果 \[ y=w^T*x \]
写的时候把年龄中缺失值全删除了,官方给了891条数据,我分了193条用于验证计算正确率,最后正确率是75.155280 %
代码如下
1 | train1=train.dropna(subset=(['Age']),axis=0) |
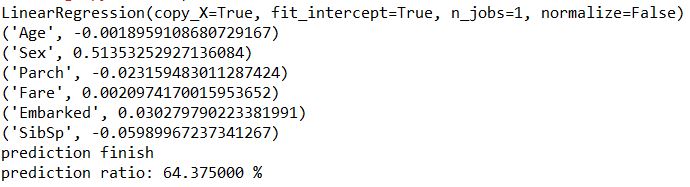
scikit-learn中的多元线性回归
试了一下scikit,增加了几个属性,一样的数据,但是好像有些属性不太好,导致正确率下降至64.375000 %
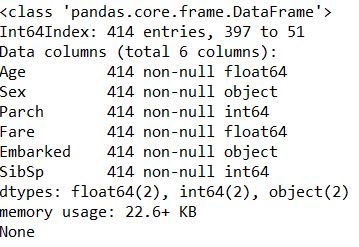
如果再模型的fit阶段出现错误,请检查你fit的x,y数据集是否出现了空元素,无限大元素,或者各个属性的长度不一致,可以用info()做一个概览
1 | train=train.dropna(subset=['Age','Embarked'],axis=0) |